Edited
Culture In-Time 2
Simple event calendar for public viewing of performing arts productions past and future.
GLAMhack 2021 - Culture inTime
GLAMhack 2021 provided the opportunity to continue working on Culture inTime, a sandbox for adding and visualizing Performing Arts Production metadata in a simple calendar-like user interface. Culture inTime was first developed during GLAMhack 2020. A few features have been added:
- Anyone with the right skills can now add their own SPARQL queries of existing linked open data (LOD) sources
- Anyone can now configure their own Spotlights based on data sources in Culture inTime
Culture inTime continues to put its focus on Performing Arts Productions. Go to https://culture-intime-2.herokuapp.com/ to try it out!
Types of Users
- Power User: Can create SPARQL queries and Spotlights on data.
- Spotlight Editor: Creates Spotlights on data.
- Browser: Uses Search functionality and pre-configured Spotlights to peruse data.
Data Sources
In the section called Data Sources, power users can add their own SPARQL queries of existing linked open data (LOD) sources to Culture inTime. The only prerequisties are:
- Technical expertise in creating SPARQL queries
- Knowledge of the graph you want to query
- Login credentials (open to all)
Two types of SPARQL queries can be added to Culture inTime
- Queries to add names of Performing Arts Productions. These queries are limited to the performing arts production title and basic premiere information.
- Queries to add supplementary data that augments specific productions. Supplementary data can be things like event dates, performers, related reviews and juxtaposed data (examples are indigenous territorial mappings, cultural funding statistics). Supplementary queries are loaded on the fly and always attached to one or more Performing Arts Production queries. To learn more about how to add queries, see the Technical Guide.
Different contributors are continuously adding and building on data sources. To see what's been added, go to https://culture-intime-2.herokuapp.com/data_sources.
Spotlights
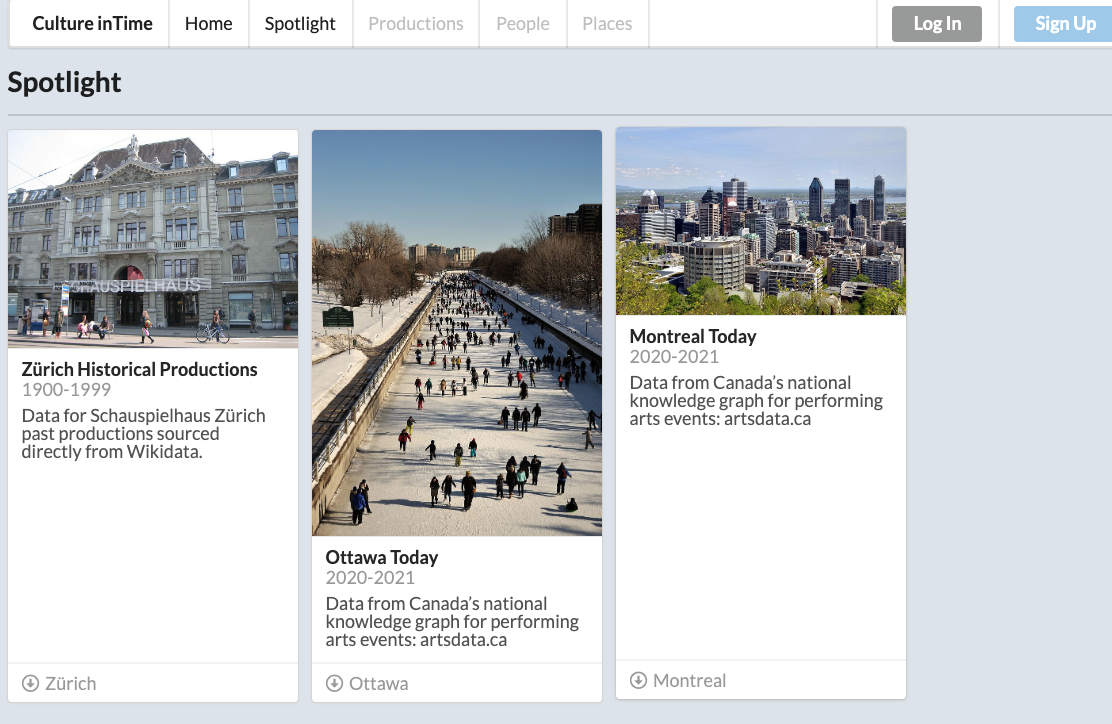
Spotlights group together productions around a theme. They can span time, locations and data sources. Once you create a login, creating spotlights is easy with a new form that allows Spotlight Editors to choose their parameters and then share their spotlight with the community. Basic editorial functionality is available. To see some Spotlights, go to https://culture-intime-2.herokuapp.com/spotlights.

Technical Guide
To add Spolights or a new data source using SPARQL, please consult this Google Doc
GLAMHACK 2020
This 2020 GlamHack Challenge resulted from the discussions we had earlier this week during the workshops related to performing arts data and our goal is to create a Linked Open Data Ecosystem for the Performing Arts.
Some of us have been working on this for years, focusing mostly on data cleansing and data publication. Now, the time has come to shift our focus towards creating concrete applications that consume data from different sources. This will allow us to demonstrate the power of linked data and to start providing value to users. At the same time, it will allow us to tackle issues related to data modelling and data federation based on concrete use cases.
“Culture InTime” is one such application. It is a kind of universal cultural calendar, which allows us to put the Spotlight on areas and timespans where coherent sets of data have already been published as linked data. At the same time, the app fetches data from living data sources on the fly. And as more performing arts data is being added to these data sources, they will automatically show up. It can:
- Provide a robust listing of arts and cultural events, both historical and current. Audiences are able to search for things they are interested in, learn more about performing arts productions and events, find new interests, et cetera.
- Reduce duplication of work in area of data entry
The code is a simple as possible to demonstrate the potential of using LOD (structured data) to create a calendar for arts and cultural events that is generated from data in Wikidata and the Artsdata.ca knowledge graph.
The user interface is designed to allow visitors to search for events. They can:
- Use the Spotlight feature to quickly view events grouped by theme.
- Use Time Period buttons to search a time period.
- Use a Search field to enter a search using the following criteria: name of production, theatre, city, or country.
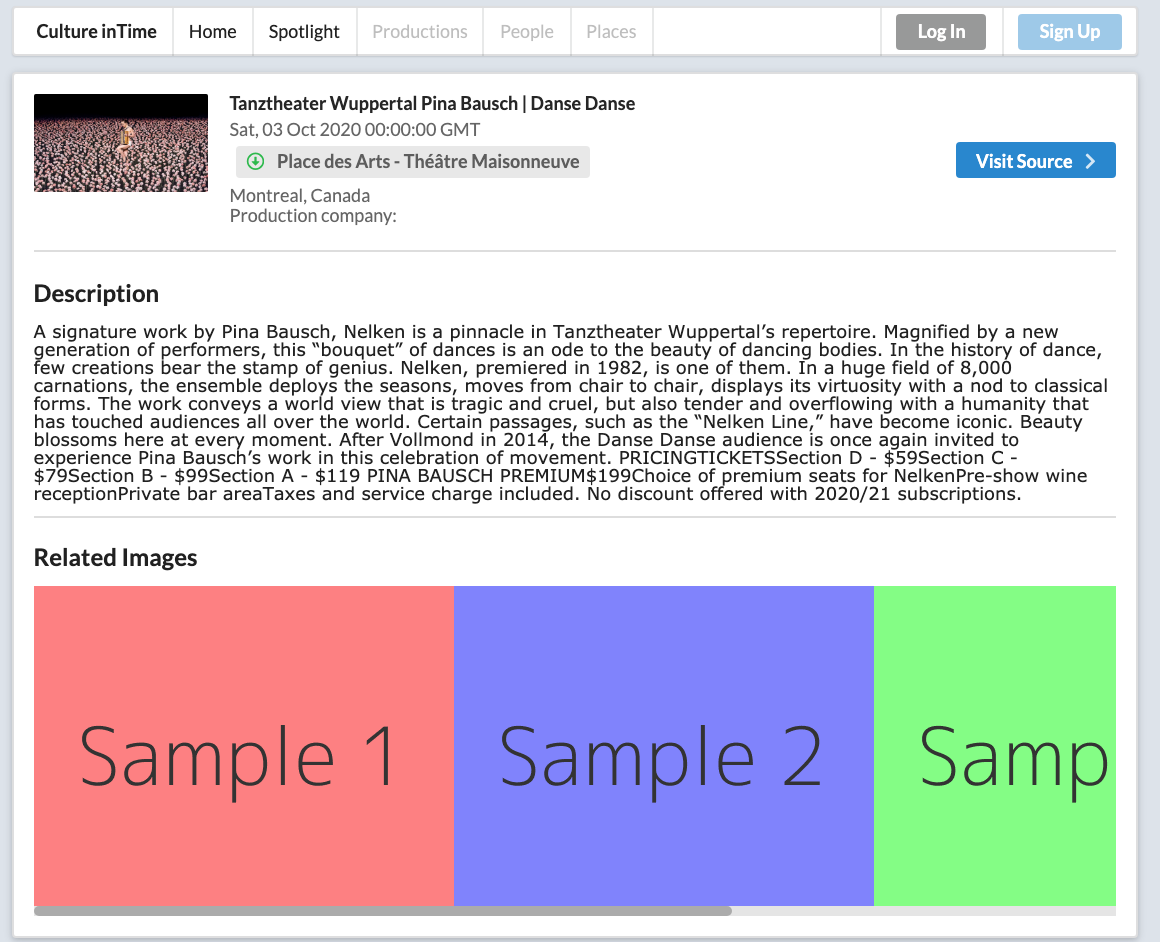
- Visit the source of the data to learn more (in the example of an Artsdata.ca event, Click Visit Event Webpage to be redirected to the Arts Organization website.
Note: Currently when you enter a location, data only exists for Switzerland and Canada (country), Zurich, Montreal/Laval/Toronto/Vancouver/Fredericton and some small villages in Quebec.
Search results list events sorted by date.
Challenges
Data is modelled differently in Wikidata, Artsdata, and even between projects within the same database. Data has very few images.
More UI Images
Spotlight Page

Event Details page - Montreal

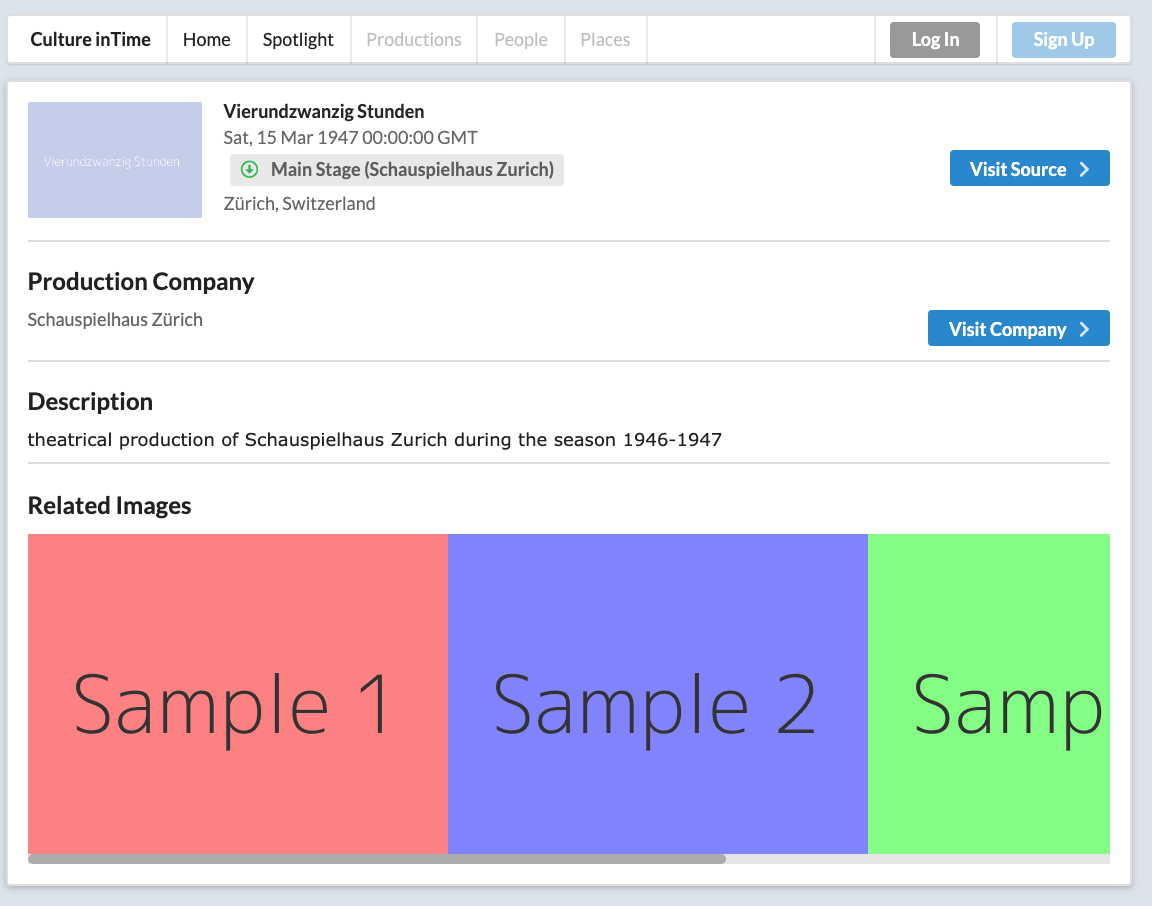
Production Details page - Zurich

Repository updated
Prototype deployed and presented. Open to public.
Joined the team
Event finish
Start
Joined the team
Repository updated
Joined the team
Challenge shared
Tap here to review.
Collection Chatbot: Silverfish
GLAMhack 2021
Deploy Looted-Art Detector

