Active projects and challenges as of 04.12.2024 18:57.
Hide full text Print Download CSV Data Package

Collection Chatbot: Silverfish
Friendly chat bot to guide you through the collection
Interactive chatbot which guides you through the collection and recommends object based on user-input. Narration driven experience of the collection.

What we achieved
- Prototype running on telegram
- Data: Dataset SKKG small selection of objects of famous people two stories:
- Sisi
- historical drinking habits
- Show images
- Show links (eg. wikipedia)
ToDo / long term vision
- automation (generate text from keywords)
- Gamification
- Memory: Ask people to select similar objects and compete against each other
- Questions: Allow people to guess the right answer
- different backend? website integration
- easy UI to manage stories etc.
- integration into collection database (Museum Plus RIA)
- more stories
- mix automated content with curated content (e.g. if there are new objects in the collection to tell a story)
Try prototype: https://t.me/SilverFishGlamBot
(if you get stuck: "/start" to restart)
For documentation see: GitHub
Contact: Lea Peterer (l.peterer@skkg.ch)
Team: Lea, Micha, Yaw, Randal, Dominic

---- Old Pitch below ----
The Stiftung für Kunst, Kultur und Geschichte (SKKG) owns a large collection of historical objects: From General Franco's toothpick holder to Sisi's piano to the spinning wheel from Appenzell.
The data on the objects consists of the name, the genre, the date, the material, the dimensions and a photograph of the object. The goal is to present this data visually or to find new contextualizations and connections within the data. There are no limits to creativity.
The data sets are:
Culture In-Time 2
Simple event calendar for public viewing of performing arts productions past and future.
GLAMhack 2021 - Culture inTime
GLAMhack 2021 provided the opportunity to continue working on Culture inTime, a sandbox for adding and visualizing Performing Arts Production metadata in a simple calendar-like user interface. Culture inTime was first developed during GLAMhack 2020. A few features have been added: * Anyone with the right skills can now add their own SPARQL queries of existing linked open data (LOD) sources * Anyone can now configure their own Spotlights based on data sources in Culture inTime
Culture inTime continues to put its focus on Performing Arts Productions. Go to https://culture-intime-2.herokuapp.com/ to try it out!
Types of Users
- Power User: Can create SPARQL queries and Spotlights on data.
- Spotlight Editor: Creates Spotlights on data.
- Browser: Uses Search functionality and pre-configured Spotlights to peruse data.
Data Sources
In the section called Data Sources, power users can add their own SPARQL queries of existing linked open data (LOD) sources to Culture inTime. The only prerequisties are: * Technical expertise in creating SPARQL queries * Knowledge of the graph you want to query * Login credentials (open to all)
Two types of SPARQL queries can be added to Culture inTime * Queries to add names of Performing Arts Productions. These queries are limited to the performing arts production title and basic premiere information. * Queries to add supplementary data that augments specific productions. Supplementary data can be things like event dates, performers, related reviews and juxtaposed data (examples are indigenous territorial mappings, cultural funding statistics). Supplementary queries are loaded on the fly and always attached to one or more Performing Arts Production queries. To learn more about how to add queries, see the Technical Guide.
Different contributors are continuously adding and building on data sources. To see what's been added, go to https://culture-intime-2.herokuapp.com/data_sources.
Spotlights
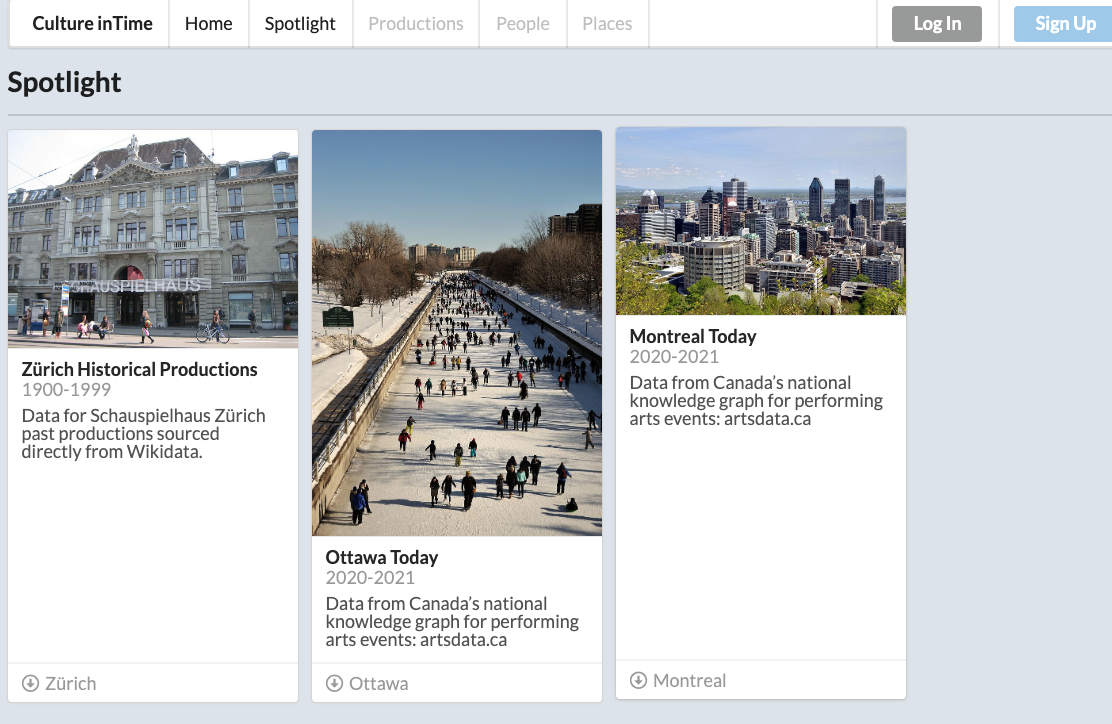
Spotlights group together productions around a theme. They can span time, locations and data sources. Once you create a login, creating spotlights is easy with a new form that allows Spotlight Editors to choose their parameters and then share their spotlight with the community. Basic editorial functionality is available. To see some Spotlights, go to https://culture-intime-2.herokuapp.com/spotlights.
Technical Guide
To add Spolights or a new data source using SPARQL, please consult this Google Doc
GLAMHACK 2020
This 2020 GlamHack Challenge resulted from the discussions we had earlier this week during the workshops related to performing arts data and our goal is to create a Linked Open Data Ecosystem for the Performing Arts.
Some of us have been working on this for years, focusing mostly on data cleansing and data publication. Now, the time has come to shift our focus towards creating concrete applications that consume data from different sources. This will allow us to demonstrate the power of linked data and to start providing value to users. At the same time, it will allow us to tackle issues related to data modelling and data federation based on concrete use cases.
“Culture InTime” is one such application. It is a kind of universal cultural calendar, which allows us to put the Spotlight on areas and timespans where coherent sets of data have already been published as linked data. At the same time, the app fetches data from living data sources on the fly. And as more performing arts data is being added to these data sources, they will automatically show up. It can: - Provide a robust listing of arts and cultural events, both historical and current. Audiences are able to search for things they are interested in, learn more about performing arts productions and events, find new interests, et cetera. - Reduce duplication of work in area of data entry
The code is a simple as possible to demonstrate the potential of using LOD (structured data) to create a calendar for arts and cultural events that is generated from data in Wikidata and the Artsdata.ca knowledge graph.
The user interface is designed to allow visitors to search for events. They can: - Use the Spotlight feature to quickly view events grouped by theme. - Use Time Period buttons to search a time period. - Use a Search field to enter a search using the following criteria: name of production, theatre, city, or country. - Visit the source of the data to learn more (in the example of an Artsdata.ca event, Click Visit Event Webpage to be redirected to the Arts Organization website.
Note: Currently when you enter a location, data only exists for Switzerland and Canada (country), Zurich, Montreal/Laval/Toronto/Vancouver/Fredericton and some small villages in Quebec.
Search results list events sorted by date.
Challenges
Data is modelled differently in Wikidata, Artsdata, and even between projects within the same database. Data has very few images.
More UI Images
Spotlight Page

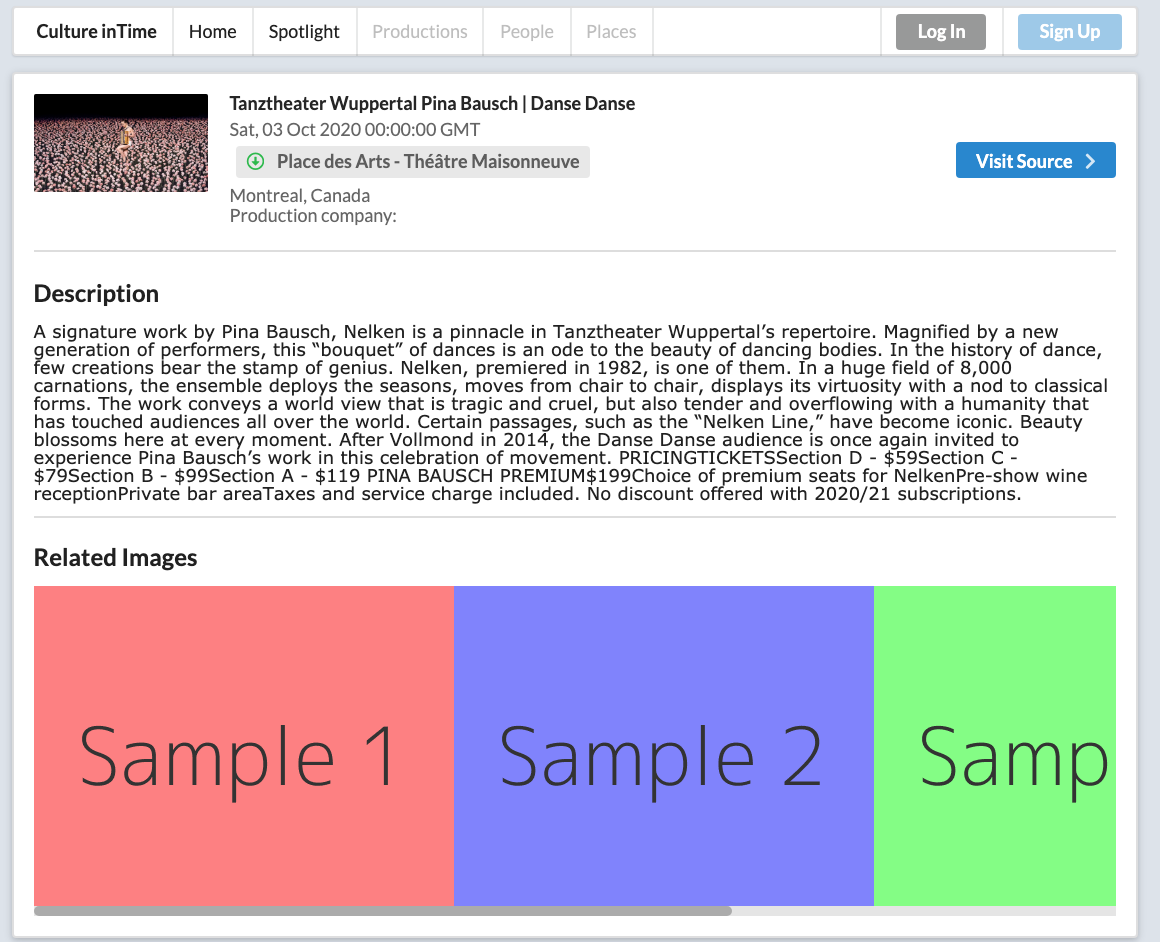
Event Details page - Montreal
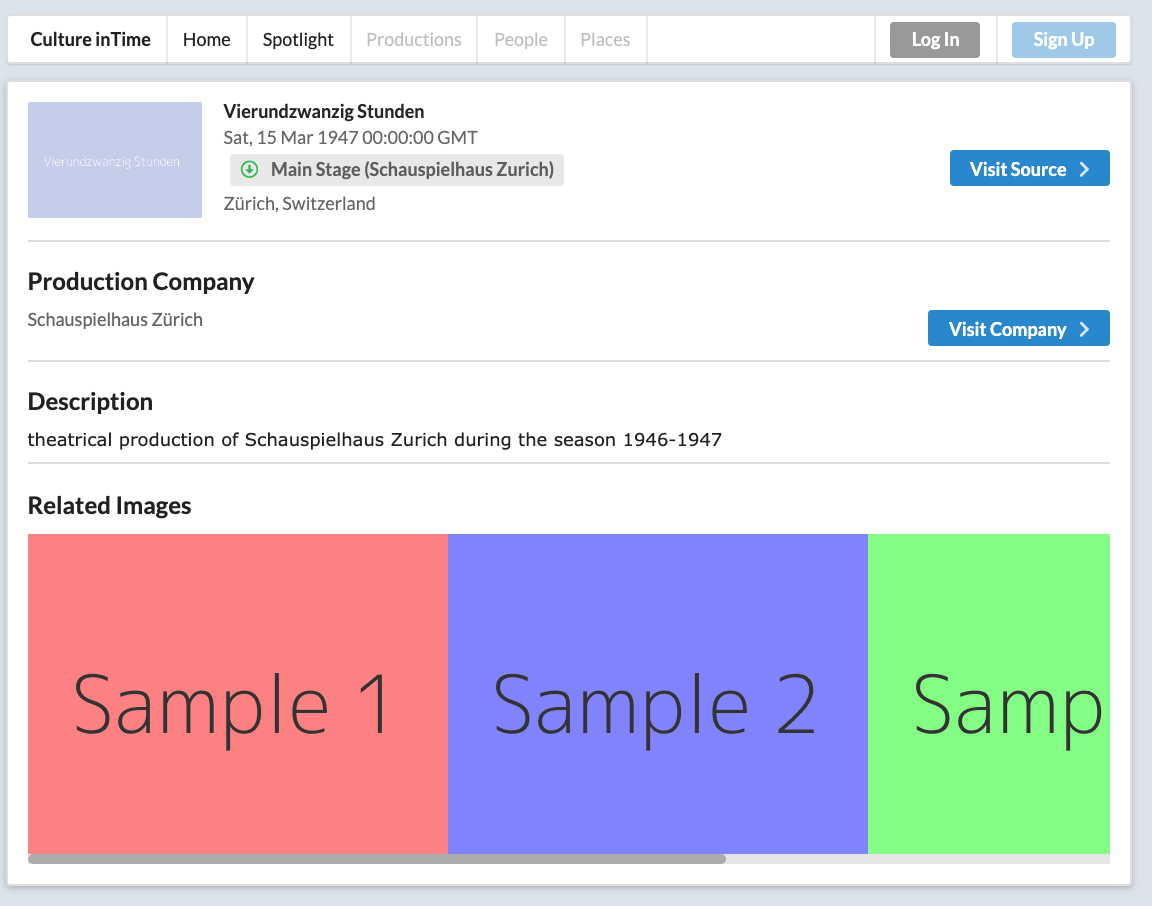
Production Details page - Zurich

Deploy Looted-Art Detector
Make it easy for anyone to use the Looted-art Detector we created at last year's Glamhack2020.
The goal is to create an easy-to-use online tool that analyses provenance texts for key indicators: UNCERTAINTY, UNRELIABILITY, ANONYMITY and RED FLAG.
The user uploads the file to analyse, and the tool enhances the file with quantitative information about the provenance texts.
Try it out! https://artdata.pythonanywhere.com

e-rara: Recognizing mathematical Formulas and Tables
The ETH Library enables access to a large number of scientific titles on e-rara.ch, which are provided with OCR. However, these old prints often also contain mathematical formulas and tables. Such content is largely lost during OCR processing, and often only individual numbers or letters are recognized. Special characters, systems of equations and tabular arrangements are typically missing in the full text.

The aim of this project is to develop a procedure for selected content, how this information could be restored.
Data
Images & Full texts from e-rara.ch
OAI: https://www.e-rara.ch/oai/?verb=Identify
Contact
Team Rare Books and Maps ETH Library
Melanie, Oliver, Sidney, Roman
ruk@library.ethz.ch

helvetiX: An XR guide to Helvetia
The ancient Romans had accurate maps of Europe, but no navigation devices yet. helevetiX now provides one.
4th century Romans travelling to foreign countries had accurate road maps of the Roman Empire. One of those Roman road maps has been preserved and today is known as "Tabula Peutingeriana" (Latin for "The Peutinger Map", from one of its former owners, Konrad Peutinger, a 16th-century German humanist and antiquarian in Augsburg). The map resembles modern bus or subway maps and shows all major settlements and the distances between them, a feature which makes it a predecessor of modern navigation systems.
The Peutinger Map is an illustrated itinerarium (ancient Roman road map) showing the layout of the cursus publicus, the road network of the Roman Empire. The map is a 13th-century parchment copy of a (possible) Roman original and is now conserved at the Austrian National Library in Vienna. It covers Europe (without the Iberian Peninsula and the British Isles), North Africa, and parts of Asia, including the Middle East, Persia, and India.
Tabula Peutingeriana, 1-4th century CE. Facsimile edition by Konrad Miller, 1887/1888
Today, HTML and its geolocation API provide a lightweight, yet powerful tool to precisely locate any device all over the world. Modern maps, open data DEMs (digital elevation models) and Extended Reality frameworks can be combined in order to create virtual worlds (see last year's Swiss Open Cultural Data Hackathon project swissAR) and geographical information systems.
helvetiX aims at providing an immersive Virtual Reality guide for any Roman merchant or legionary when travelling to ancient Helvetia. (In Latin, of course.)
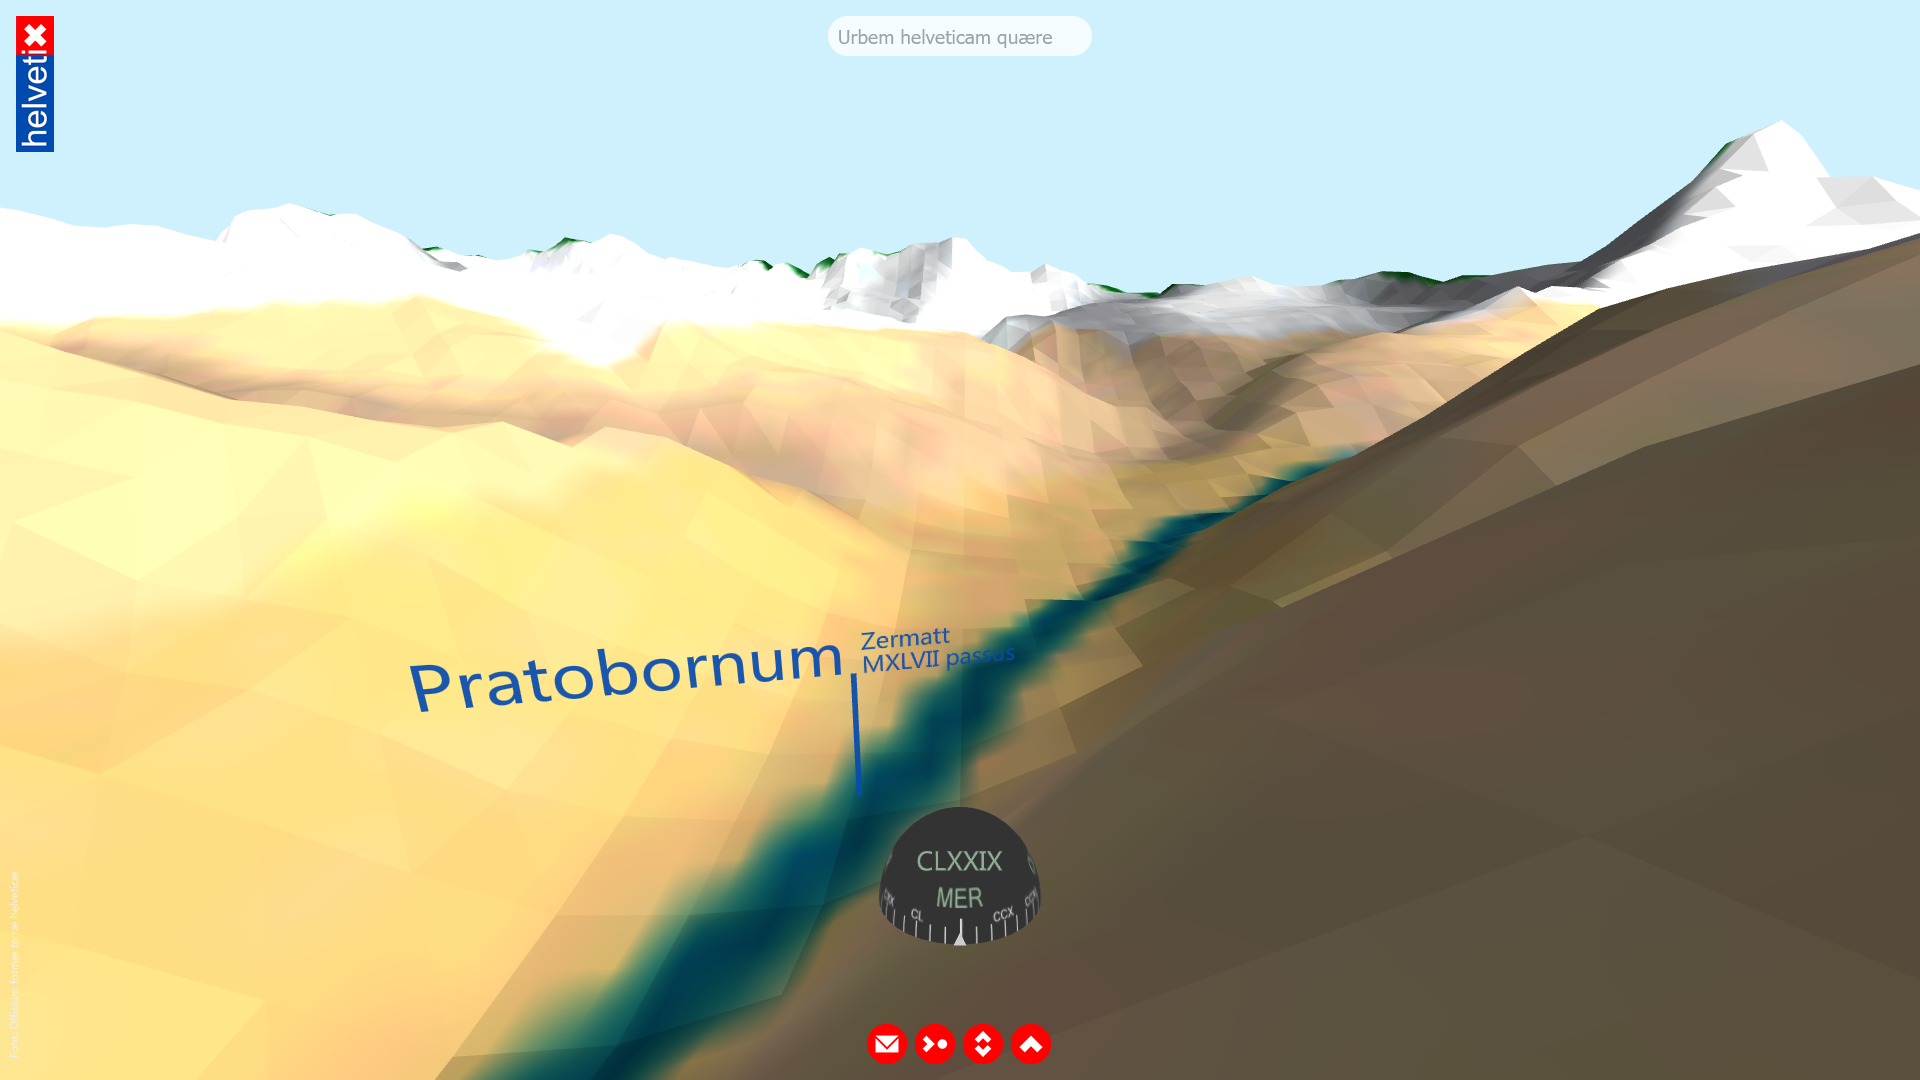
Pratobornum (Zermatt), 1047 double steps away: Screenshot from the helvetiX prototype.
Instructions
Launch helvetix.thomasweibel.ch in your web browser or point your smartphone camera to the QR code.

- Desktop: Navigate by dragging the landscape to the desired direction.
- Smartphone: Confirm both motion sensor access and GPS positioning, then turn around.
Data
opendata.swiss: Digital elevation model
opendata.swiss: Map of Switzerland
opendata.swiss: Official place name directory
opendata.swiss: Toponymy data
Objects
Switzerland in 3D (1:1 scale, low resolution, glb format, 24.3 MB, download)
Switzerland in 3D (1:1 scale, high resolution, glb format, 113.4 MB, download)

3D model of Switzerland, on a 1:1 scale, based on a 200 meter grid, in glb format. (Source: Swiss Federal Office of Topography swisstopo)
Documents
swisstopo.ch: Transformations- und Rechendienste
swisstopo.ch: Näherungsformeln für die Transformation zwischen Schweizer Projektionskoordinaten und WGS84
Wikipedia: Schweizer Landeskoordinaten
Wikipedia: Alte Maße und Gewichte (römische Antike)
Conversions
Decimal degrees to Swiss coordinates
The HTML 5 geolocation API returns user coordinates in decimal degrees. In order to use the Swiss coordinate system (either in the LV03 or the LV95 format) these coordinates have to be converted by
if (navigator.geolocation) { // ask for user permission to retrieve user location

  navigator.geolocation.getCurrentPosition(function(position) { // callback function success, set coords to user location

  var b1=position.coords.latitude∗3600; // calculate swiss coords

  var l1=position.coords.longitude∗3600;

  var b2=(b1-169028.66)/10000;

  var l2=(l1-26782.5)/10000;

  var n=200147.07+308807.95∗b2+3745.25∗Math.pow(l2,2)+76.63∗Math.pow(b2,2)+119.79∗Math.pow(b2,3)-194.56∗Math.pow(l2,2)∗b2;

  n+=1000000; // omit if using LV03 format

  var e=600072.37+211455.93∗l2-10938.51∗l2∗b2-0.36∗l2∗Math.pow(b2,2)-44.54∗Math.pow(l2,3);

  e+=2000000; // omit if using LV03 format

  }, function () { // callback function error

  ...

  });

}
(Source, p. 3.)
Integers to Roman Numerals
Integers (Math.round(num)>0, as there is no zero in the ancient Roman numeral system) can be converted to Roman numerals byfunction romanize(num) {
if (isNaN(num/1.48176))
return NaN;
var digits=String(+num).split(""),
key=["","C","CC","CCC","CD","D","DC","DCC","DCCC","CM",
"","X","XX","XXX","XL","L","LX","LXX","LXXX","XC",
"","I","II","III","IV","V","VI","VII","VIII","IX"],
roman="",
i=3;
while (i--) roman=(key[+digits.pop()+(i*10)] || "")+roman;
numeral=Array(+digits.join("")+1).join("M")+roman;
}(Source)
About
helvetiX derives from swisspeaX, a web VR project providing geographical information (place names, hills and mountain peaks, rivers and lakes) based on the user's current location and heading. The aim of the project is to provide a web VR platform for displaying any type of spatial, Swiss geography-related GLAM information.
Tech
The project has been built by means of the Javascript framework A-Frame. It uses a flat-file database; all geographical names and spatial data are stored in external Javascript array files.
Team
- Thomas Weibel
- Roberta Padlina
Contact
Thomas Weibel
Realpstr. 55
4054 Basel
www.thomasweibel.ch
thomas.weibel@bluewin.ch
Nachtschicht 21 a 3D, Virtual Reality & Art Exhibition
We want to showcase the artworks of swiss contemporary artists in a VR space.
Nachtschicht21 https://www.nachtschicht21.ch/ is curating artworks of young swiss contemporary artists. During this hackathon we'd like to create beside the gallery exhibition, which will start on the 11.5.2021, a VR space, in which the works can be made accessible to everyone around the globe. This we plan to do with A Frame.
Data to work with during the two days hackathon: https://drive.google.com/drive/folders/1_6AoAPutT2V7uh6ZE9W9S1OJwklS3KWF?usp=sharing
SoMe-channel of Nachtschicht 21 https://www.instagram.com/nachtschicht21/
Nachtschicht21 (GLAMHACK2021)
- Interactive Virtual Reality 3d Exhibition
Goal
Explore and discover the possibilities of A frame has to offer for a VR immersive experience.
Project Description
The initial concept was to transform the content from the website Nachtsicht21 into a more immersive experience with the use of Virtual reality visualisation means.
After some discussion, the team decided to bring the user in a space framework and to dispose paintings in this colourfull environment such as if they were forming a new constellation.
In addition, some animation were associated to each painting to allow the visitor to better appreciate the images on the the panels.
Screenshots
Here are some screenshots from the designing process of the VR environment:


Weblinks
https://353893-4.web1.fh-htwchur.ch/im4/Nachtschicht21/index_5.html
St. Galler Globus
Conceptualizing Interactive Narratives for a "Scientainment" Audience

Among the many treasures of the Zentralbibliothek Zürich the St. Galler Globus offers a controversial history, interdisciplinary research approaches and narrative richness. The globe is a magnificent manifestation of the world concept of the late 16th century. The modern (for its time) cartographical knowledge, representation of current (i.e. contemporary) and historical events and diverse mirabilia combined with its overwhelming size and opulent paint job certainly led it to be a “conversational piece” wherever it was exhibited.
Even though it is a fully functional earth and celestial globe regarding its size and elaborative decorative artistry, it is assumed that the globe was more of a prestigious showpiece than a scientific instrument. The globe's full splendor is best appreciated by exploring the original at the Landesmuseum Zürich or its replica in the Stiftsbibliothek St. Gallen. Because of its size and fragility it is not possible to make the globe fully accessible for exploration to the public.
That is where you can step in! Fortunately the ETH Institute of Geodesy and Photogrammetry made a high resolution 3D prototype available for both the original and the replica globe (Low Resolution Preview: https://hbzwwws04.uzh.ch/occusense/sg_globus.php).
Combined with the rich expertise around the St. Galler Globus we want to create digital concepts of how we could make the St. Galler Globus’ narratives and historical context accessible to a broader audience interested in “Scientainment”. We are looking for people who want to create digital prototypes, write and visualize narratives, conceptualize interactive experiences or find other ways to show the rich narratives of the St. Galler Globus.
With those concepts we want to show the potential inherent in exhibiting a digital version of the St. Galler Globus.
Passwords to the sources: Magnetberg
The Pellaton Experience
Turning oral history into an interactive information network
Ursula Pellaton (*1946) is a walking encyclopedia of Swiss dance history. Her enthusiasm for dance began in 1963 with a performance of "Giselle" in Zurich. That was the beginning of her many years of involvement with dance, which has accompanied her ever since as a journalist and historian, among other things.

She shared a lot of her knowledge in 16 hours of video recordings that were the basis for a biography in traditional book form. However, both video and book are limited by their linear narratives that differ from our experience of history as a living network of people, places, events, and works of art. Based on a longer excerpt from the recordings and its transcript, we would like to turn this oral history document into a comprehensive online experience by creating a navigable interface and augmenting the video with supplementary information and material.
Contact: Birk Weiberg, Swiss Archive of the Performing Arts, birk.weiberg@sapa.swiss
The scene lives!
Opening a dataset of underground multimedia art
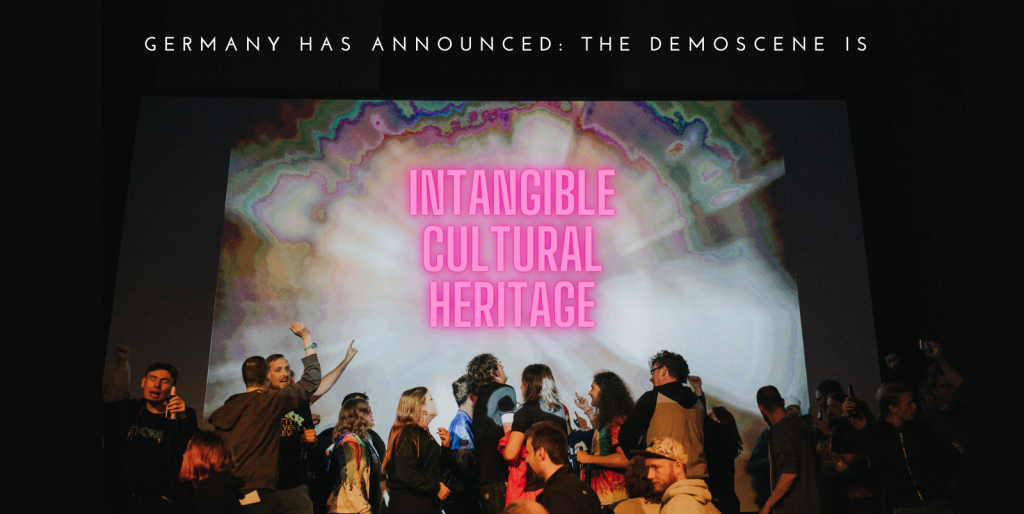
Create an open dataset of demoscene productions, which could be filtered to individual countries, themes, or platforms, and help make the demoscene more accessible to people who may have never heard about it. This dataset could be of interest from an art-history perspective to complement our UNESCO digital heritage application - or just be used to introduce people to the history of the 'scene.
Outputs
- Project report (Readme above)
- Backend: Data Package & API
- Frontend: Demo app
https://raw.githubusercontent.com/we-art-o-nauts/the-scene-lives/master/datapackage.json
Prior art
This project is closely related to the Swiss Video Games Directory from previous OpenGLAM events, and was quite inspired by this tweet:
title: The Scene lives! tags: echtzeit description: Echtzeit x GLAMhack 2021 slideOptions:
theme: dark
<tt style="font-size:70%">
TL;DR - Presenting (see intro) Echtzeit = Contributors to international demoscene - GLAMhack / OpenGLAM = Community of international culture-data wranglers - Our #GLAMhack 2021 project: https://hack.glam.opendata.ch/project/114 - Prototype web app: https://scene.rip/ - Source code app: https://github.com/we-art-o-nauts/the-scene-lives-app - Prototype API: https://api.scene.rip/productions - Data + API: https://github.com/we-art-o-nauts/the-scene-lives - Slack channel: #team-26-echtzeit-x-openglam
</tt>
10'000 m goals
- Make the demoscene more accessible to people who may have never heard about it. (:wave: hello #GLAMhack!)
- Create an open dataset of demoscene productions, which could be filtered to individual themes or platforms.
- Support the UNESCO digital heritage application, or just explore the history of the 'scene.
..Or just tune into SceneSat :headphones: and enjoy electronic art at the hackathon!
Elevated by Urszula "Urssa" Kocol
Our GLAMhack roadmap
- [x]
10 Mine some data fromdemozoo - [x]
20 Collect a few bytes frompouët - [x]
30 Create an initialData Package - [x]
40 Document process ofaggregation - [x]
50 Set up a basic demoservice - [x]
60 Push dataset as openrepository - [x]
70 Propose a standard(TM)schema - [x]
80 Create and demo theprototype - [ ] ... :moneymouthface:
:point_down: The drilldown
Road by PG and R0ger
Pouet logo by tomaes
trumpets
The oldest and most well known central repository, pouët, makes daily data exports available at https://data.pouet.net/ with a JSON API endpoint at https://api.pouet.net/ and the open source code of it at https://github.com/pouetnet/pouet2.0-api
We downloaded and tried to parse the raw JSON with a couple of tools, and didn't manage to get far. Convoluted structure and formatting errors were rather demotivating. Nevertheless it influenced our thoughts about a "demoscene data standard", and brainstorm ideas of improving overall data quality (for example, we immediately noticed mismatched dates and missing values).

This API was also recently used to do some terrific data analysis, and we reached out to the authors to find out if we can reuse their scripts. We have also reached out via the #pouet Discord for guru meditation.

demozoo
The Demozoo API is basic but usable: http://demozoo.org/api/v1/ As it's a paginated web service, it would require a bit of scraping code to aggregate. So we used the 'nuclear option' of getting the database dump in raw SQL format. Importing this into a local SQLite database (inspired by all of Wikipedia in SQLite) and then re-exported the tables in CSV format. This should be done differently for automated data updates.
We have reached out via the #demozoo Discord and GitHub for some further ideas.
package
A popular current way to crowdsource open data in a distributed way is the Data Package, the preferred format for doing this using the Frictionless Data project, which has a create tool to generate an initial datapackage.json.
An initial data package based on the Demozoo archive is at GitHub, which compiles and aggregates the data from several tables using the Python dataflows library.

schema
Exploring and transforming the data gives us a frame of reference based on which to think about some commonalities and differences between different archives' approaches. We did some research to see what effort in this direction was already made, and reached out to the Demozoo and Pouet communities.
Each of the data sources have a schema of their own, and some attempts at consolidation have been made. We started with a simplified version of the Demozoo model, created a Table Schema which can be used for validation or annotation as JSON Schema.
repository
Our dataset repository clearly explains its sources, but also points out there are many other places which could be future data acquisition targets. These notable scene repositories and data sources include:
- https://demozoo.org/ (as above)
- https://pouet.net/ (as above)
- https://csdb.dk/
- https://zxart.ee/
- https://ada.untergrund.net/
- https://files.scene.org/
- https://www.demoparty.net/
service
While the Data Package is nice to look at in it's JSON glory, most people (and programmers) will want some kind of interface to it. We wrote a small server using the Falcon Framework to produce a barebones API. Since the data is loaded using a Frictionless Data wrapper for the Pandas library, it can incorporate various advanced sorting and filtering routines. Our proto-service is currently running at a private VPS hosted on Linode, but should also work on 'lambda function' hosts like Vercel or Heroku.

Still from Traffic Jam by Chainsaw
prototype
If we make it this far, we would like to make a basic example of data usage. After all this data wrangling, we didn't have time to really explore the space of user interface possibilities. But we have a small application that demonstrates the API with an infinite-scrolling user interface showing productions.

See for yourself at https://scene.rip
Ideas to build upon
- Establish live feed graph view of demoscene productions
- Create an infographic that helps to explain the demoscene
- An interactive app for scrolling through prods (e.g. Netflix or Giphy clone)
- A cheatsheet to learn the most important terms and famous groups/prods
- A virtual reality exhibition (like other teams are working on)
More or less irrelevant links
- Thread showing various graphs of prod release stats from Pouët https://twitter.com/pouetdotnet/status/1345056403338231808
- Discussion of "greets graph" https://www.pouet.net/topic.php?which=12099&page=1
- Some debate about classification https://www.pouet.net/topic.php?which=12098
- Discussion of Demozoo API https://demozoo.org/forums/66/
- Oleg's blog explaining the demoscene, partially on the topic of "letting the data speak for itself" https://blog.datalets.ch/010/
- Teaser Revision 2017 seminar "Graph databases and the demoscene universe" https://2017.revision-party.net/events/seminars
- Ideas from demosceners on GitHub https://github.com/nesbox/TIC-80/discussions/1286
- Internet Archive gallery https://archive.org/details/softwarelibraryc64demos "To some, the heart of the Demoscene - the self-playing examples of programming and artistic prowess of the last 30 years on the underpowered but extremely flexible C64."
Demo or :skullandcrossbones: die!
:sheep: Thanks for watching!
:love_letter: seism@utou.ch :bird: @seismist
Pass it forward: hackmd.io/@oleg/the-scene-lives
<small>This presentation is shared under CC BY 4.0</small>
WikiCommons metadata analysis tool
A metadata analysis tool comparing metadata of GLAM source systems with Wikimedia Commons.
The Image Archive of the ETH Library is the largest Swiss GLAM image provider. Since the ETH-Bibliothek went Open Data in March 2015, the image archive has uploaded 60,000 out of more than 500'000 images to Wikimedia Commons. The tool Pattypan is currently used for uploading.
On the image database E-Pics Image Archive Online, volunteers have been able to comment on all images since January 2016, thereby improving the metadata. And they do it very diligently. More than 20,000 comments are received annually in the image archive and are incorporated into the metadata (see also our blog "Crowdsourcing").
However, the metadata on Wikimedia Commons is not updated and is therefore sometimes outdated, imprecise or even incorrect. The effort for the image archive to (manually) match the metadata would simply be too great. A tool does not yet exist.
Challenge
A general GLAM analysis tool that compares the metadata of the source system of the GLAMs (e. g. E-Pics Image Archive Online) and Wikimedia Commons and lists the differences. The analysis tool could highlight the differences (analogous to version control in Wikipedia), the user would have to manually choose for each hit whether the metadata is overwritten or not. Affected metadata fields: Title, date, description, ...
Automatic "overwriting" of metadata (update tool) is against the Wikimedia philosophy and is therefore undesirable. Furthermore, it is also possible that Wikipedians have made corrections themselves, which are not recorded by the image archive.
Data
Bildarchiv Online, http://ba.e-pics.ethz.ch
Wikimedia Commons: https://commons.wikimedia.org/wiki/Category:Media_contributed_by_the_ETH-Bibliothek
Pattypan, Wikimedia Commons Upload Tool: https://commons.wikimedia.org/wiki/Commons:Pattypan
Blog Crowdsourcing: https://blogs.ethz.ch/crowdsourcing/
Contact
Nicole Graf, Head Image Archive ETH Library
Wikidata Tutorial Factory
Or how to efficiently produce Wikidata tutorials for heritage institutions
Challenge
Our Hackathon project consists in producing a website with Wikidata tutorials specifically aimed at heritage institutions. The tutorials shall cover a broad range of topics, providing simple explanations for beginners in several languages. The tutorials will be gathered on a website, where users can either look for specific instructions or go through the whole programme of tutorials. In this perspective, we have created a storyboard going from a general introduction to the usefulness of Wikidata for GLAMs to tutorials explaining how to edit specific information.
The tutorials are based on powerpoint presentations with audio tracks. We have prepared a template to facilitate the tutorial production during the hackathon. We also have scripts for some of the topics. We will be using applications such as deepl to automatically translate the scripts. With the use of “text to speech” converters, we will record the scripts in English, French, German and Italian. This will allow us to produce many tutorials in the short time span of the GLAMhack.
A second aspect of our project consists in producing a short video as an introduction to our website. This video should explain what kind of information is registered about GLAMs in Wikidata and what benefits the institutions can draw from the database.
We are looking for participants who are interested in sharing their Wikidata knowledge, people who have experience with fun and easy tutorials, people who know wordpress to work on the website, polyglots who can edit the automatically generated translations or people without any Wikidata know-how who want to help us develop the user journey of our tutorial programme by trying it out. For the short introduction video, we are looking for multimedia producers.
Project Documentation
General Procedure 1. Create a template for the tutorials: Powerpoint presentation with space holders for audiofiles 2. Make a list of topics that could be covered in the tutorials 3. Create a website where to publish the tutorials 4. Produce as many tutorials as possible!
Tutorial organisation tree:

Tutorial Factory 1. Prepare a powerpoint presentation with the script in English as notes and the screenshots in the language of the tutorial 2. Transform the script into audiofiles with spoken word (see this repository for a way to do this using Google Cloud) 3. Insert the audiofiles into each slide and adapt the animation according to the spoken word 4. Translate the script into another language and replicate the screenshots in the new language 5. Repeat steps 2 and 3
Note: leave the written script as a note on each slide. This makes the tutorials user friendly to persons with hearing impairment and also facilitates the translation into other languages.
Website 1. Create an upload system 2. Create a landing page for each language with the list of topics 3. Enable users to download the tutorials and leave a comment
Outcome - 7 tutorial scripts in English - 3 tutorials in German - 4 tutorials in English - 2 tutorials in Italian - 2 tutorials in French - website in 2 languages (German and English)
Link to website: https://tutorials.schoolofdata.ch/
Project Team: Annina Clara Engel Alicia Fagerving Sarah Fuchs Valérie Hashimoto Oliver Waddell Nicolai Wenger
Contact: Valérie aka GLAMoperator > hashimotoval@gmail.com
Challenges
1971 and all that - Women’s Right to Vote in Switzerland
How did the discourses around the women's suffrage evolve over time in Switzerland?
1971 and all that
2021 marks the 50th anniversary of women’s suffrage in Switzerland: a perfect opportunity to investigate what led to the events in 1971 and what happened since then.
In our challenge, we focused on the discourse around women, feminism and women’s right to vote in Switzerland by analysing relevant newspaper articles. Our aim was to apply natural language processing methods on those texts that are accessible via the impresso app. This app - product of an SNF funded project - contains a huge number of digitised articles that were published between 1740 and 2000. It mainly features historical newspaper collections, but also the archives of Le Temps and the Neue Zürcher Zeitung. Some of the articles from the Impresso corpus are subject to copyright, therefore we cannot share them publicly.
In this corpus we wanted to identify characteristic topics that are related to women’s suffrage in Switzerland. We created a topic model and an interactive wordcloud in a Jupyter notebook. A first topic model which still has to be improved has been visualised. Further steps would be to visualize how the identified topics in the articles referring to the women's suffrage evolved over time, e.g. by a timeline slider.
By Heinz Baumann, Comet Photo AG (Zürich) - This image is from the collection of the ETH-Bibliothek and has been published on Wikimedia Commons as part of a cooperation with Wikimedia CH. Corrections and additional information are welcome., CC BY-SA 4.0, https://commons.wikimedia.org/w/index.php?curid=99507189
Archived-Data-Diver
Automatically generate an overview of large archived datasets
Finding and viewing open datasets can be time consuming. Datasets can take a long time to download, and after exploring them you realise it is not in the form you needed.
The idea is to create a tool that could run on open data providers' servers, but also on a local computer, which automatically generates an overview of the files, images and along with some summary statistics.

A walk trough Zurich around 1910
Following the paths of Friedrich Ruef-Hirt discovering his fascinating photographs taken between 1905 and 1910.
A new data set contains images by the photographer Friedrich Ruef-Hirt (1873-1927). Between about 1905 and 1910, he systematically documented all the neighbourhoods of the new greater Zurich area after the town's expansion in 1893. In just a few years, he created a unique collection of pictures of houses and streets. The pictures were originally available as postcards.
The city's Archives of Architectural History (Baugeschichtliches Archiv der Stadt Zürich) contain more than 1000 postcards by Friedrich Ruef-Hirt. They offer a unique opportunity to reconstruct the city around 1910. Since the artist numbered his works on the front side it might be possible to re-live his photographic walks through town on an contemporary map or in the new 3D street model published by the city of Zurich.
- Dataset: https://data.stadt-zuerich.ch/dataset/baz_zuerich_um_1910
- Browse the pictures: http://baz.e-pics.ethz.ch/index.jspx?category=801
- Map of Zurich 1913: http://baz.e-pics.ethz.ch/index.jspx?category=26197 (also available already georeferenced)
- 3D-Model of Zurich: https://www.stadt-zuerich.ch/ted/de/index/geoz/geodaten_u_plaene/3d_stadtmodell.html
Some more historical Background
The City of Zurich contained of no more than 12'000 Buildings around the year 1910 (compared to almost 55'000 today). In one thousand of the houses in 1910 there was some kind of bar or restaurant (a.k.a. 'Bierhalle' or 'Trinkstube') included, which means in almost every 10th building! Lots of these establishments were located in the corner house of a block and lots of them can be seen and identified in Ruef-Hirts photographs. Names and locations of the restaurants can be found in the old adress books of the city (a very useful source for historical Research by any means), see: https://drive.google.com/drive/folders/12cnmRlf_PUZ1Jb9aWpKqHwi-tuVRIWUg?usp=sharing (unfortunately not fully online digital yet).
Contact: Saro Pepe Fischer, Baugeschichtliches Archiv der Stadt Zürich, Neumarkt 4, 8001 Zürich | saro.pepefischer@zuerich.ch


Project Documentation (work in progress):
Friday, 16.4.2021 //
11:00h: Group forming.
Team members:
Saro Pepe Fischer
Elias Kreyenbuehl
Jan Sandberg
Michel Piguet
Kenny Floria
13:00h: First tests with implementing the historical Pics of Ruef-Hirt in maps and 3D applications:


15:00h: Decision to narrow the project down to the city's quarter "Aussersihl Inustrie" and especially the "Langstrasse".
15:45h: A first milestone, this newly generated map with the historical pictures:
http://glamhack21.kennyfloria.ch/
Code to the map-/picture-application:
https://github.com/PaulKC/glamhack2021-a-walk-trough-zurich-around-1910
16:30h: Remodelling pictures for integration in a 3D-view:


22:30h: Implementing the 1913 city map as a new background:


Saturday, 17.4.2021 //
09:30h: Presentation of the implementing of the 3D-model of the City of Zurich (real Buildings) for the filmic walk through "Langstrasse 1906":


13:30h-15:00h: Fighting the video programmes and trying to render, edit and export the files. We are getting there...
15:30h: Putting all the pieces together for the short 90 second movie.
16:30h: Link to the video: https://drive.google.com/file/d/1l6BIubsoJQMlxY1kj_V3a7uMkOP2LlGh/view

heARTful – Art & Emotions
Dicovering artworks through emotions
Brief project description:
Everybody experiences emotions. This is the starting point for a journey of discovery through art, on which we would like to take as wide an audience as possible.
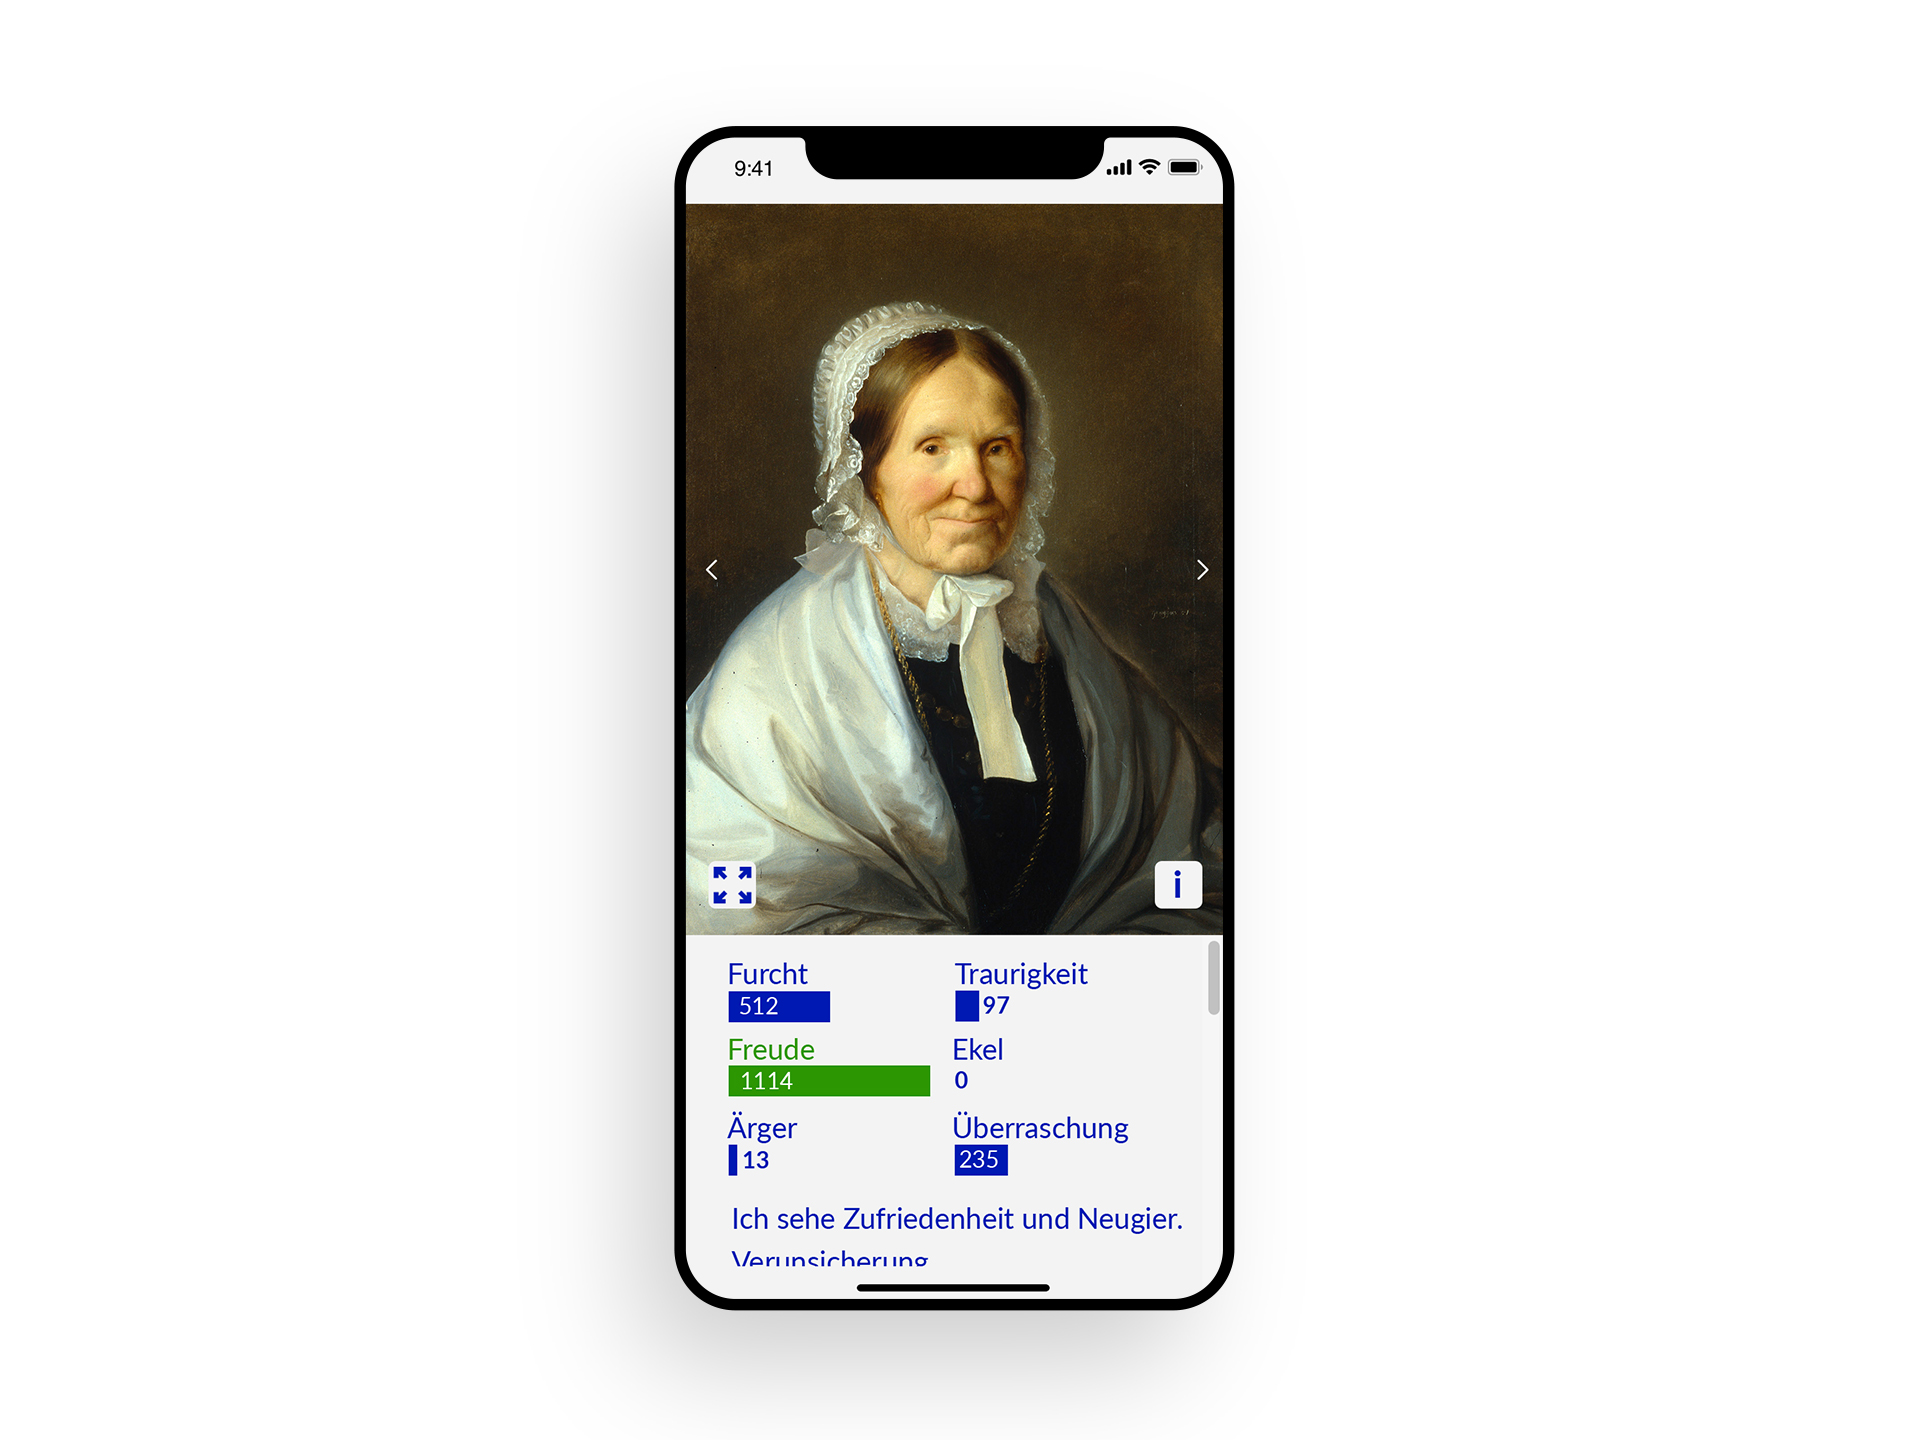
A web app shows artworks and asks users which emotion(s) they trigger in them. The six universal basic emotions of fear, joy, anger, sadness, disgust and surprise are suggested. There is also the possibility of describing one's own feelings in a differentiated way in a free text field.
After clicking on one emotion tag, you can see how other users feel about this artwork.
An info button can be used to display the «reverse side» of the picture, which contains precise information about the artwork (artist, title, date, technique, dimensions, copyright, picture credits).
Arrow navigation takes you to the next work of art, which can be responded to emotionally.
Technical description:
The project team worked with image and metadata from the photo archives of the Swiss Institute of Art Research SIK-ISEA. Link to the data sets:
https://opendata.swiss/de/dataset/kunstwerke-aus-dem-bildarchiv-von-sik-isea
https://opendata.swiss/de/dataset/werkverzeichnis-der-kunstlerin-eva-aeppli-1925-2015
A node.js server and a react-frontend are used. The webapp runs in the browser and is therefore accessible under a URL.As an admin, any selection of images can be loaded into the app and made available to a specific audience.
Possible contexts of application: Art education, museum, school, art therapy
Project team: Anna Flurina Kälin, art educator und information scientist; Jan Lässig, digital art educator and multimedia producer; Thomas Stettler, information scientist; Angelica Tschachtli, art historian
Link to project presentation: https://museion.schule/vermittlung/heARTful-presentation.pdf
/// IN GERMAN ///
Inhaltliche Kurzbeschreibung:
Emotionen kennen alle Menschen. Sie sind der Ausgangspunkt für eine Entdeckungsreise durch die Kunst, auf die wir ein möglichst breites Publikum mitnehmen möchten.
Eine Webapp zeigt Kunstwerke und fragt die User*innen, welche Emotion(en) sie in ihnen auslösen. Vorgeschlagen werden die sechs universellen Basisemotionen Furcht, Freude, Ärger, Traurigkeit, Ekel, Überraschung. Es gibt auch die Möglichkeit, in einem Freitext-Feld die eigenen Gefühle differenziert zu beschreiben.
Nach dem Anklicken der Emotion wird eingeblendet, was andere User*innen zu diesem Kunstwerk fühlen.
Über einen Info-Button kann die «Rückseite» des Bildes angezeigt werden, auf der die genauen Informationen zum Kunstwerk angegeben sind (Künstler*in, Titel, Datierung, Technik, Masse, Copyright, Bildnachweis).
Mit einer Pfeilnavigation kommt man zum nächsten Kunstwerk, auf das emotional reagiert werden kann.
Technische Beschreibung:
Das Projektteam hat mit Bild- und Metadaten aus dem Fotoarchiv des Schweizerischen Instituts für Kunstwissenschaft SIK-ISEA gearbeitet. Link zu den Datensets:
https://opendata.swiss/de/dataset/kunstwerke-aus-dem-bildarchiv-von-sik-isea
https://opendata.swiss/de/dataset/werkverzeichnis-der-kunstlerin-eva-aeppli-1925-2015
Verwendet wird ein node.js-Server und ein react-frontend. Die Webapp läuft im Browser und ist abrufbar unter einer URL. Als Admin kann eine beliebige Bildauswahl in die App geladen und einem bestimmten Publikum zugänglich gemacht werden.
Mögliche Kontexte der Anwendung: Vermittlung, Museum, Schule, Kunsttherapie
Projektteam: Anna Flurina Kälin, Kunstvermittlerin und Informatikerin; Jan Lässig, Digitaler Kunstvermittler und Multimediaproduzent; Thomas Stettler, Informatiker; Angelica Tschachtli, Kunsthistorikerin
Link zur Projektpräsentation: https://jan-laessig.ch/wp-content/uploads/2022/10/heARTful-presentation.pdf

Making digitised scores audible
The Zentralbibliothek Zurich and several other Libraries in Switzerland own large numbers of music scores. Several of these scores are accessible via the digital platforms e-manuscripta and e-rara. But what if you want to hear the music instead of just seeing the score sheets?
We would like to make digitised music scores deposited on e-manuscripta and e-rara audible, using OMR and notational software. Our overall goal would be to develop a workflow resulting in audio files. Such a workflow would at any rate include manual steps. Rather than developing a fully automated pipeline, this little explorative study is an attempt to find out about the potentials of OMR in a cultural heritage context, possibly making written music more accessible.
Presentation
Documentation
Tools
- Audiveris Optical Music Recognition
- Verovio, A music notation engraving library
- Musescore Notation Software
- IIIF Curation Tool
Data
Team
- Anna Keller
- Henrike Hoffmann
- Alexa Renggli
- Neni Milo
- Nobutake Kamiya
- Lionel Walter
Image: Hans Georg Nägeli: Christliche Lieder zur Feyer der Reformation, Zürich 1818, Zentralbibliothek Zürich, Mus WB 7132 (https://doi.org/10.3931/e-rara-20956)
The spatial evolvement of a Museums’ collection
How did geopolitics and scientific interests affect provenances in a collection of 75 000 European artefacts?
The Museum der Kulturen Basel (MKB) is the largest ethnographic museum in Switzerland and one of the most eminent of its kind in Europe. The MKB collections are renowned throughout the world; in total they hold over 340 000 artefacts from all over the world. A large number of them stems from various places in Europe – from northern Scandinavia to the South of Greece, from Portugal to the Carpathians, from remote Alps to bustling cities. This European collection comprises around 75 000 artefacts, such as religious objects, handicraft, cloths, pictures, toys and everyday items. They came into the museum’s collection as acquisitions or gifts during the last 120 years.
While in the very beginning the focus of the collectors was on objects from remote Swiss hamlets, the interest slowly shifted to artefacts from industrialised environments. Changing geopolitical developments enabled collecting in different regions of Europa at different times. Also, personal interests or personal connections of single collectors led to sudden large additions from one specific area.
The goal of this challenge is to show the rise and fall of dominant geographical provenances during the last 120 years of collecting in Europe. This could enable the answer to interesting questions such as: Which specific spatial interests arose and fell during the last 120 years? How did the idea of Europe’s border change over time? When was the peak of collecting in remote Swiss valleys? Which were the effects of the First and the Second World War on the geographical provenance of new acquisition? How did the fall of the Iron Curtain affect the collection practice?
The data provided by MKB has never been published before. It stems from a database used for managing the collection, which grew over generations. There are inconsistencies on different levels, as errors and omissions occurred both when the objects were first cataloged and when the catalogues were transcribed into the database. Terminologies contained therein may today be inaccurate, outdated, or offensive. The provided material may be raw – but to the same extent its quantity and uniqueness is precious!

